

A DAG can help you take the right path. The image is CC by Ian Sane
I recently wrote about blood transfusions and their inherent risk of postoperative infections. This post is a tutorial on some of the basics of drawing a directed acyclic graph (DAG). Blood transfusions and infections is a great topic as most are familiar with risk factors for infections.
A DAG contains three elements:
- Directed arrows – each arrow has a causal direction
- Acyclic – the arrows can not be arranged to form a circle
- Graph – a visualization helps us understand the complex relations
The current post will not go into the details of DAGs, the aim is to show how to quickly generate a reasonable DAG. If you are interested in the specifics you can look at either Sander’s or Shrier and Platt’s excellent articles on the subject.
For this tutorial I will use Friedman et al’s article on blood transfusions as a risk for infections after arthroplasty surgery. Their method section suggests that they adjusted for the following confounders:
- Age
- Sex
- Type of surgery (total knee arthroplasty compared with total hip arthroplasty)
- Body mass index of > 40 kg/m2
- Race (Caucasian compared with other races)
- Medical history of cardiac disease (yes/no)
- Hypertensive disorders (yes/no)
- Renal impairment (yes/no)
- Diabetes (yes/no)
- Blood or lymphatic system disorders (yes/no)
- Geographic region (United States and Canada compared with other countries)
- Duration of surgery
Throughout the post I will be using the amazing DAGitty-tool that is available for free at DAGitty.net. All plots have associated “Model text data” that you can copy->paste into tool in order to regenerate the images and to edit them at free will. After entering the above factors I ended up with something like this:
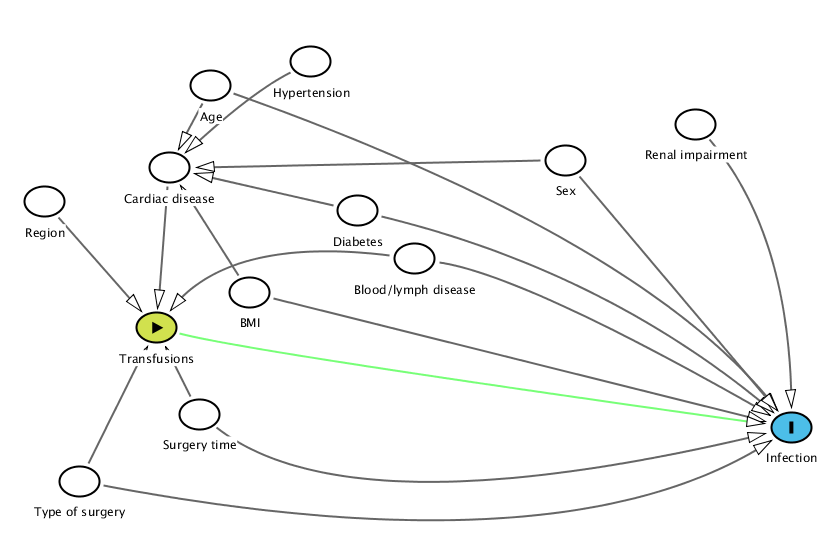
The raw DAG from the article methods section
Age A @0.317,0.037
BMI A @0.350,0.563
Blood%2Flymph%20disease A @0.492,0.478
Cardiac%20disease A @0.281,0.246
Diabetes A @0.443,0.356
Hypertension A @0.403,-0.024
Infection O @0.816,0.908
Region A @0.174,0.333
Renal%20impairment A @0.734,0.135
Sex A @0.622,0.227
Surgery%20time A @0.307,0.874
Transfusions E @0.270,0.654
Type%20of%20surgery A @0.204,1.045

Age Cardiac%20disease Infection @0.689,0.429
BMI Infection Cardiac%20disease
Blood%2Flymph%20disease Infection @0.588,0.522 Transfusions @0.334,0.420
Cardiac%20disease Transfusions
Diabetes Infection @0.656,0.510 Cardiac%20disease
Hypertension Cardiac%20disease @0.351,0.054
Region Transfusions
Renal%20impairment Infection @0.814,0.414
Sex Infection Cardiac%20disease
Surgery%20time Infection @0.437,1.176 Transfusions
Transfusions Infection @0.349,0.715
Type%20of%20surgery Infection @0.622,1.277 Transfusions
One can always argue that the relations are different but I think the graph is reasonable. As you can see, nodes should be connected to both the exposure (transfusions) and the outcome (infections). If they aren’t then it is uncertain if they actually belong in the model. Note that in the current graph:
- Region may be associated with different protocols for transfusions but it is more difficult to see that the regions have a large variety in infections. An argument could be made that there is a connection but hospitals included in this study should be top-notch and are therefore unlikely to have a large variety in infections for the included patient type.
- Hypertension is certainly a risk factor for cardiac disease but the connection to infections is most likely weak.
- Renal failure should not affect the number of transfusions unless the hematocrit is low, although there is a link to infections.
Removing these gives a slightly clearer picture:
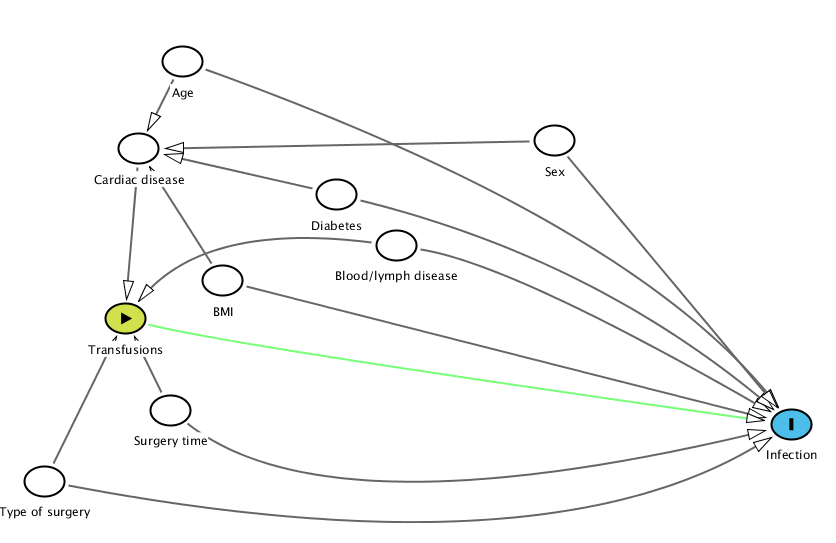
Somewhat cleaner DAG
Age A @0.317,0.037
BMI A @0.350,0.563
Blood%2Flymph%20disease A @0.492,0.478
Cardiac%20disease A @0.281,0.246
Diabetes A @0.443,0.356
Infection O @0.816,0.908
Sex A @0.622,0.227
Surgery%20time A @0.307,0.874
Transfusions E @0.270,0.654
Type%20of%20surgery A @0.204,1.045

Age Cardiac%20disease Infection @0.689,0.429
BMI Infection Cardiac%20disease
Blood%2Flymph%20disease Infection @0.588,0.522 Transfusions @0.334,0.420
Cardiac%20disease Transfusions
Diabetes Infection @0.656,0.510 Cardiac%20disease
Sex Infection Cardiac%20disease
Surgery%20time Infection @0.437,1.176 Transfusions
Transfusions Infection @0.349,0.715
Type%20of%20surgery Infection @0.622,1.277 Transfusions
Although the graph is simpler it lacks a an important detail – knowledge of why we transfuse patients. Looking at guidelines is always a good starting point. The UK blood and transfusion services have a neat handbook and some simple guidelines. Also, Joy and Bennet’s article on “The appropriateness of blood transfusion following primary total hip replacement” touches on the subject, giving us a fairly good idea of why we transfuse patients. Adding this knowledge to the graph generates the following:
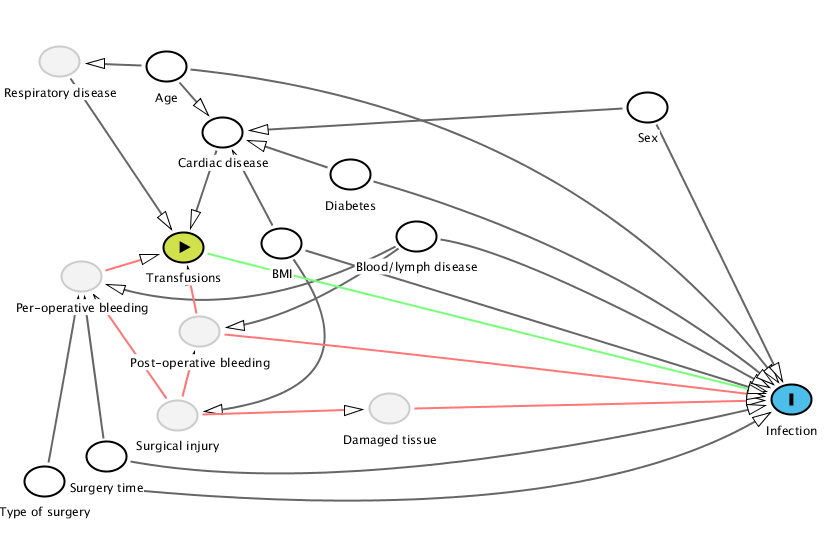
A DAG with knowledge of transfusion causes
Age A @0.276,0.032
BMI A @0.376,0.496
Blood%2Flymph%20disease A @0.492,0.478
Cardiac%20disease A @0.325,0.205
Damaged%20tissue U @0.469,0.932
Diabetes A @0.435,0.316
Infection O @0.816,0.908
Per-operative%20bleeding U @0.203,0.585
Post-operative%20bleeding U @0.305,0.730
Respiratory%20disease U @0.184,0.019
Sex A @0.692,0.139
Surgery%20time A @0.224,1.059
Surgical%20injury U @0.286,0.949
Transfusions E @0.291,0.507
Type%20of%20surgery A @0.171,1.123

Age Cardiac%20disease Respiratory%20disease Infection @0.626,0.144
BMI Infection Cardiac%20disease Surgical%20injury @0.465,0.885
Blood%2Flymph%20disease Infection @0.588,0.522 Post-operative%20bleeding @0.394,0.688 Per-operative%20bleeding @0.341,0.719
Cardiac%20disease Transfusions
Damaged%20tissue Infection
Diabetes Infection @0.656,0.510 Cardiac%20disease
Per-operative%20bleeding Transfusions
Post-operative%20bleeding Transfusions Infection @0.482,0.784
Respiratory%20disease Transfusions
Sex Infection Cardiac%20disease
Surgery%20time Per-operative%20bleeding Infection @0.437,1.176
Surgical%20injury Post-operative%20bleeding Per-operative%20bleeding Damaged%20tissue
Transfusions Infection @0.367,0.569
Type%20of%20surgery Per-operative%20bleeding @0.188,0.847 Infection @0.622,1.277
It now is rather obvious that we should have adjusted for smoking, especially since respiratory disease is not adjusted for. This is a very strong risk factor for both cardiovascular and respiratory disease while at the same time a very strong risk factor for infections, see Hans Nåsell’s excellent thesis.
We can also start theorizing between the different confounder’s importance. In my opinion, the surgical injury is vastly more important than a few patients with blood disease. It would be more interesting adjusting for CRP, myoglobin or some other marker than blood disease. Frank Harrell puts it nicely:
- Decide how many d.f. can be spent
- Decide where to spend them
- Spend them
- Don’t reconsider, especially if inference needed
The d.f. stands for degrees of freedom and is at a minimum a single variable. Even in large studies we need to consider how many variables the study model can handle. The planning should not only be of what possible variables to include, but also their importance.
Furthermore, we can remove diabetes as transfusions are not directly dependent and the model already contains cardiovascular disease. While it may seem natural to include diabetes, it seems there is little support for it in the DAG.
Conversely, I would leave BMI in the model. BMI has a known connection with infections and due to its impacts on both cardiovascular status and the surgical trauma it makes sense to leave it in.
Sex and age are in the category “compulsory confounders” – while I haven’t been able to fit them nicely into the DAG, they have most likely an impact not covered in the DAG. For instance, the fear of non-diagnosed cardiovascular diseases for elderly may for instance drive transfusion rates while age simultaneously affects the immune response. Women have a lower risk for implant infections and are known to have a different hematocrit tolerance and could thus be subjected to a different treatment.
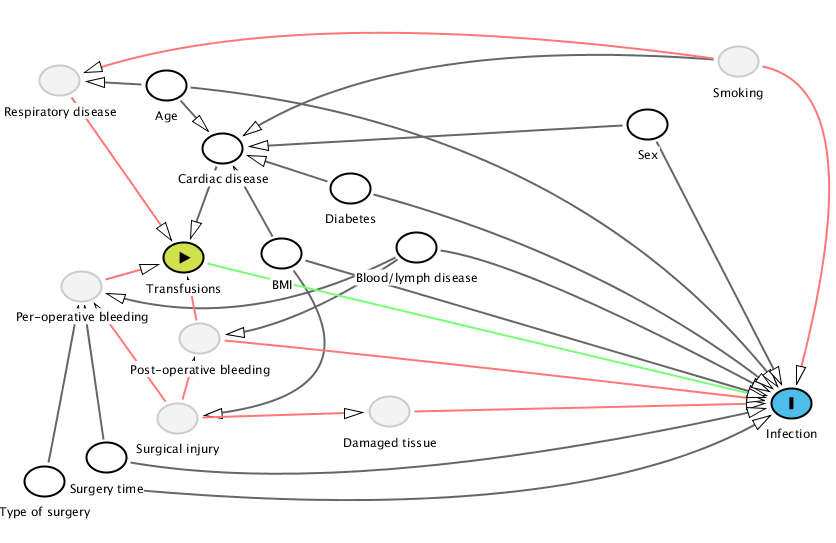
The final DAG with the adjusted and unadjusted nodes
Age A @0.276,0.032
BMI A @0.376,0.496
Blood%2Flymph%20disease A @0.492,0.478
Cardiac%20disease A @0.325,0.205
Damaged%20tissue U @0.469,0.932
Diabetes A @0.435,0.316
Infection O @0.816,0.908
Per-operative%20bleeding U @0.203,0.585
Post-operative%20bleeding U @0.305,0.730
Respiratory%20disease U @0.184,0.019
Sex A @0.692,0.139
Smoking U @0.770,-0.033
Surgery%20time A @0.224,1.059
Surgical%20injury U @0.286,0.949
Transfusions E @0.291,0.507
Type%20of%20surgery A @0.171,1.123

Age Cardiac%20disease Respiratory%20disease Infection @0.626,0.144
BMI Infection Cardiac%20disease Surgical%20injury @0.465,0.885
Blood%2Flymph%20disease Infection @0.588,0.522 Post-operative%20bleeding @0.394,0.688 Per-operative%20bleeding @0.341,0.719
Cardiac%20disease Transfusions
Damaged%20tissue Infection
Diabetes Infection @0.656,0.510 Cardiac%20disease
Per-operative%20bleeding Transfusions
Post-operative%20bleeding Transfusions Infection @0.482,0.784
Respiratory%20disease Transfusions
Sex Infection Cardiac%20disease
Smoking Cardiac%20disease @0.476,-0.104 Infection @0.888,0.046 Respiratory%20disease @0.388,-0.200
Surgery%20time Per-operative%20bleeding Infection @0.437,1.176
Surgical%20injury Post-operative%20bleeding Per-operative%20bleeding Damaged%20tissue
Transfusions Infection @0.367,0.569
Type%20of%20surgery Per-operative%20bleeding @0.188,0.847 Infection @0.622,1.277
In summary
A DAG gives an interesting overview of the relationship between variables. It helps us to think of and visualize relations. It can also be a valuable aid in finding variables that you haven’t originally thought of or identifying variables that you don’t need.
Furthermore, don’t expect the perfect DAG, view it as a work-in-progress. It will also aid and clarify your discussions with your co-authors/reviewers. The ultimate goal is of course to limit the amount of late changes that often require a substantial amount of work.
Note: The above discussion is for transfusion yes/no. Friedman et al. also compared allogenic versus autologous transfusions and this can radically change the graph as the decision to provide allogenic vs. autologous transfusion is much more complicated.