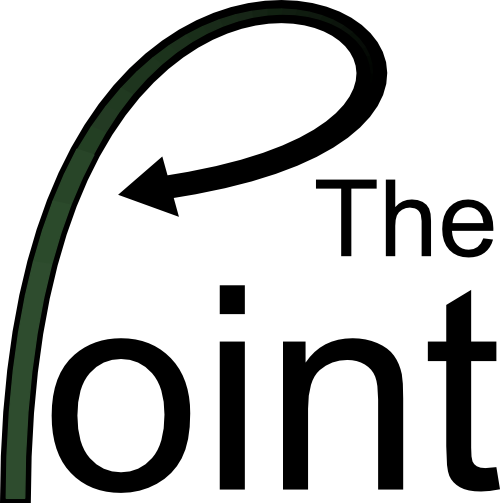
An alternative bezier arrow to the regular grid-bezier. Apart from a cool gradient it has the advantages of: exact width, exact start/end points and axis alignment.
About two weeks ago I got frustrated with the bezierGrob function in the grid package. The lwd parameter is interpreted differently depending on device, the arrow at the end does not follow the line but is perpendicular (probably following the spline control), and the line parameter makes it difficult to control exactly where the line starts/ends. Thus I decided to make my own fancy line with an arrow at the end – at the time I thought: How hard can it be? In retrospect, I wish I never thought of the thing… This article is about the painful process of creating of an alternative to the bezierGrob. Continue reading