This tutorial is on how to create a neat table in Word by combining knitr and R Markdown. I’ll be using my own function, htmlTable, from the Gmisc package.
Update: With the latest RStudio verions getting tables from R into Word is even easier, see my new post on the subject.
Background: Because most journals that I submit to want the documents in Word and not LaTeX, converting my output into Word is essential. I used to rely on converting LaTeX into Word but this was tricky, full of bugs and still needed tweaking at the end. With R Markdown and LibreOffice it’s actually rather smooth sailing, although I must admit that I’m disappointed at how bad Word handles html.
The tutorial
We start with loading the package, and labeling the dataset. The labels and the units are from the Hmisc package:
library(Gmisc, verbose=FALSE)

data(mtcars)

label(mtcars$mpg) <- "Gas"
units(mtcars$mpg) <- "Miles/gal"

label(mtcars$wt) <- "Weight"
units(mtcars$wt) <- "103 lb"

mtcars$am <- factor(mtcars$am,
                    levels=0:1,
                    labels=c("Automatic", "Manual"))
label(mtcars$am) <- "Transmission"

mtcars$gear <- factor(mtcars$gear)
label(mtcars$gear) <- "Gears"

# Make up some data for making it slightly more interesting
mtcars$col <- factor(sample(c("red", "black", "silver"),
                            size=NROW(mtcars),
                            replace=TRUE))
label(mtcars$col) <- "Car color"
Now we calculate the statistics. The getDescriptionsStatsBy() is a more interesting alternative to just running table(). It can also run simple statistics that often are reported in table 1.
mpg_data <- getDescriptionStatsBy(mtcars$mpg, mtcars$am, html=TRUE)
rownames(mpg_data) <- units(mtcars$mpg)
wt_data <- getDescriptionStatsBy(mtcars$wt, mtcars$am, html=TRUE)
rownames(wt_data) <- units(mtcars$wt)

gear_data <- getDescriptionStatsBy(mtcars$gear, mtcars$am, html=TRUE)
col_data <- getDescriptionStatsBy(mtcars$col, mtcars$am, html=TRUE)
Next we create the actual table with htmlTable. We can also have an internal reference to the table using the <a href=“#Table1” >, click here. The latex() function that I've used as a template for the parameters (to be able to quickly switch between the two) can feel a little overwhelming:
- x - just the matrix with all the cells
- caption - nothing fancy, just the table caption
- label - this is transferred into an href anchor, <a name=“#label” ></a>
- rowlabel - the contents of the top left cell
- rgroup - the label of the groups, this is the unindented header of each group
- n.rgroup - the number of rows that each group contains, note that this is not the position of the group but the number of elements in them, i.e. sum(n.rgroup) == nrow(x)
- ctable - a formatting option from LaTeX that gives top/bottom border as single lines instead of double.
htmlTable(
  x        = rbind(gear_data, col_data, mpg_data, wt_data),
  caption  = paste("My table 1. All continuous values are reported with",
                   "mean and standard deviation, x̄ (± SD), while categories",
                   "are reported in percentages, no (%)."),
  label    = "Table1",
  rowlabel = "Variables",
  rgroup   = c(label(gear_data),
               label(col_data),
               label(mpg_data),
               label(wt_data)),
  n.rgroup = c(NROW(gear_data),
               NROW(col_data),
               NROW(mpg_data),
               NROW(wt_data)),
  ctable   = TRUE)
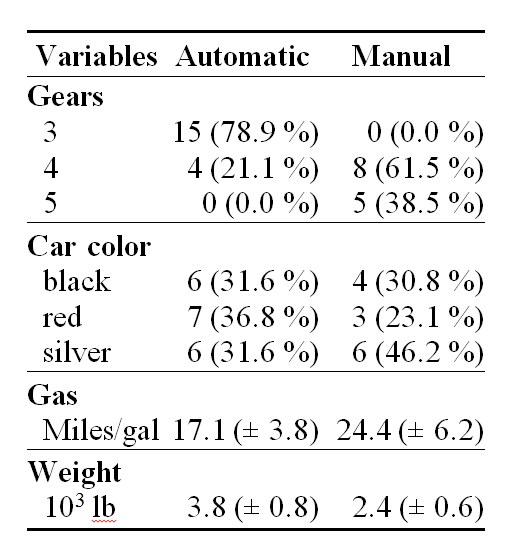
Below is the table. Note: the table is formatted by this blog CSL, it will look different after running the Rmd document through knitr.
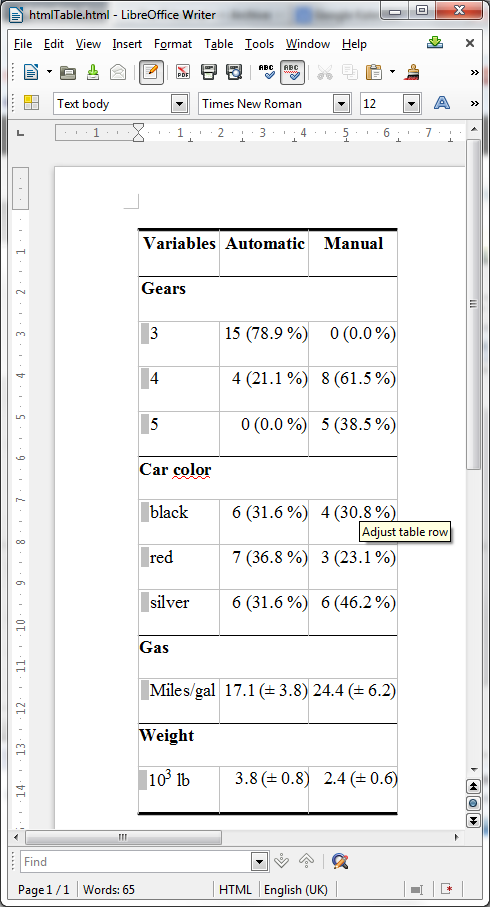
Now install and open in LibreOffice Writer the html document that knitr has created:
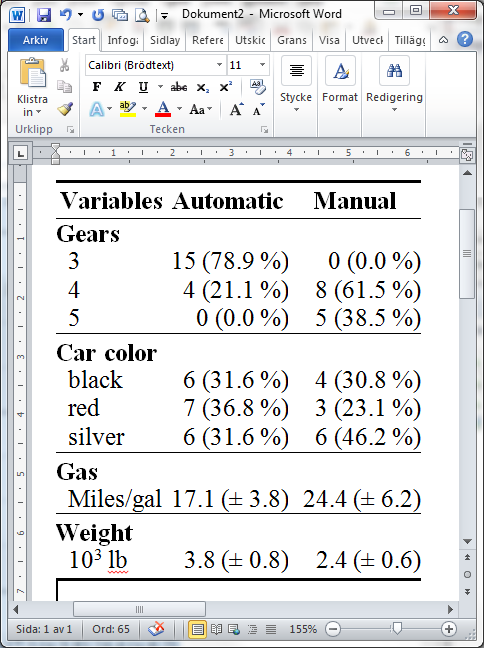
Now select the table, copy and paste into word, voila!


just thought you might like to see how I put gmisc htmlTable to use
Tables Are Like Cockroaches
thanks so much for a great post and a fine package
Thanks! Interesting post, it never stops amazing me how much tinkering one can do with a simple table. I’ll consider adding to the code options of super cgroups (not sure what to call them) and for styling each row. I just hope that people don’t find the options overwhelming. I’ve tried to document as much as I can but I know from my own experience that reading manuals is not that exciting…
I’ve copy and pasted your entire code into R Markdown and used Knitr. I get the following output:
Reproducing example
Variables
Automatic
Manual
Gears
3
15 (78.9 %)
0 (0.0 %)
4
4 (21.1 %)
8 (61.5 %)
5
0 (0.0 %)
5 (38.5 %)…
I feel like I’m making a very silly and obvious mistake here, but I can’t for the life of me understand what it is. Your example looks amazing and I hope I can use it to create my own tables if I only figure out what’s going wrong. Any suggestions? Thanks.
You’re code lacks any details regarding the raw output. Have you put the results=”asis” into the chunk specification?
Hi, I’ve been using htmlTables for a while now and they are great…. but have you found a way to get them directly into word or pdf with pandoc or knitr, without copy-pasting from a compiled html file?
I tried pandoc a while ago but actually never with the htmlTables, I guess using pandoc’s
--process-htmloption might be a worth a try. Let me know if it works.Hi Max,
Were you ever able to convert the html table to a word or pdf document?
Very cool! However, with the latest R version (3.0.1), your package cannot be loaded
Strange, works fine here. What errors do you get, what system are you using and how have you tried to install the package? I’ve uploaded a new version, although the previous should work OK.
Hi, great package.
How would you get the column header “Transmission” to appear above “Automatic” and “Manual” in your htmlTable ?
Whoops, found it in your package documentation! Awesome. (for others curious, the argument is cgroup=””)
I like your package very much. Is it possible to allow more flexibility by allowing multiple levels of headings? The current “cgroup” and ‘n.cgroup’ only take a vector, it will be nice to allow a matrix so several layers of (nested) headings can be displayed. Thanks!
Thank you. That shouldn’t be that difficult to implement. Would you consider writing a short guest post with an example to show how it works?
Is it possible to have data in the same row as the row group header? I want a column for p-values, but when it is a multivariate test, there is only one p-value per row group. Thanks!
This is currently not supported but it’s easy to work around the problem by simply adding the rowg roup header manually and all the subelements with “ ” (two non-breaking spaces) before the names of the sub-elements of the row in order to attain the same look and feel.
I am using describeFactors() and the rownames are quite long. I would like to wrap the long rownames. Is this possible? Another question is how to manually put horizontal and vertical lines in the table?
Thanks for this package…the tables are beautiful! I just worked through this tutorial and I have encountered a problem. In my table one of my variables is “Sex”, the attribute label of this variable in my data frame is also “Sex”. However, when the table prints out, the rgroup label says “Male sex”. When I check the attributes of the data object created by getDescriptionStatsBy, it now says: “Male sex” for the label. Incidently, in the table, the first category listed is also “Male sex”, even though the labels for the factors are “Male” and “Female”. Do you know why it changed?
This is partially a bug that is fixed in the develop branch (see how to install that branch here). If you have a true proportion then the function automatically adds the level + varname as this makes more sense – the bug occurred when forcing factors by changing the prop_fn function to describeFactors when this should not occur.
I generally recommend using the mergeDesc-function that makes everything much easier, there is a vignette in the package that describes how to use it – I’m currently lagging a little behind on my R-blogging but I hope to write a post about it soon.