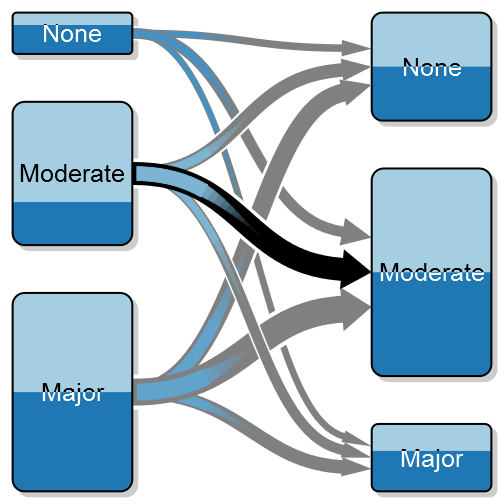
A transition between states – the above is a simulation of before and after surgery where I’ve highlighted the large proportion that doesn’t improve in the moderate group.
As an orthopaedic surgeon I’m often interested in how a patient is doing after surgery compared to before. I call this as a transition between states, e.g. severe pain to moderate pain, and in order to better illustrate these transitions I’ve created something that I call a transition plot. It’s closely related to the plotMat for plotting networks but aimed at less complex relations with only a one-way relation between two groups of states.
This project started by me posting a question on Stack Overflow, the answers were (as always) excellent, but didn’t really satisfy my needs. What I wanted was a graphically appealing plot that I could control in extreme detail. Thanks to Paul Murrell’s excellent grid package I was able to generate a truly customizeable transition plot.
In this post I’ll give a short introduction with examples to what you can do with the transitionPlot()-function. I’ll try to walk you through simple transitions to more complex ones with group proportions and highlighted arrows. Continue reading
