
Fast-track publishing using knitr: intro (part I)

A beautiful old document. Probably state of the art in those days. The image is CC by storebukkebruse.

A beautiful old document. Probably state of the art in those days. The image is CC by storebukkebruse.

Fast-track publishing using knitr is a short series on how I use knitr to get my articles faster published. By fast-track publishing I mean eliminating as many of the obstacles as possible during the manuscript phase, and not the fast-track some journals offer. In this first introductory article I will try to (1) define the main groups of obstacles I have experienced motivating knitr, (2) options I’ve used for extracting knitted results into MS Word. The emphasis will be on general principles and what have worked for me. Continue reading

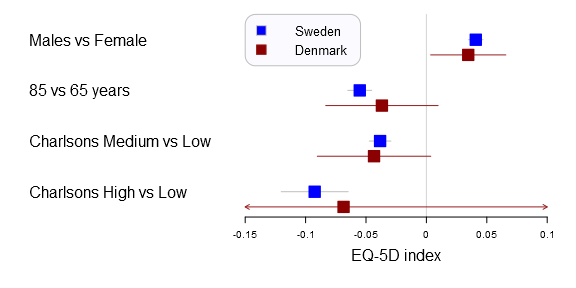
The forestplot of dreams

A forestplot that compares Swedish and Danish EQ-5D outcome predictors

A forestplot that compares Swedish and Danish EQ-5D outcome predictors generated with the forestplot2()-function in the Gmisc-package

Displaying large regression models without overwhelming the reader can be challenging. I believe that forestplots are amazingly well suited for this. The plot gives a quick understanding of the estimates position in comparison to other estimates, while also showcasing the uncertainty. This project started with some minor tweaks to prof. Thomas Lumleys forestplot and ended up in a complete remake of the function. In this post I’ll show you how to tame the plot using data from my latest article. Continue reading