Fast-track publishing using knitr is a short series on how I use knitr to speedup publishing in my research. There has been plenty of feedback and interest for the series, and in this post I would like to provide (1) a brief summary and (2) an example showing how to put all the pieces together. Continue reading
Category Archives: Tutorial
Fast-track publishing using knitr: table mania (part IV)
Fast-track publishing using knitr is a short series on how I use knitr to speedup publishing in my research. While illustrations (previous post) are optional, tables are not, and this fourth article is therefore devoted to tables. Tables through knitr is probably one of the most powerful fast-track publishing tools, in this article I will show (1) how to quickly generate a descriptive table, (2) how to convert your regression model into a table, and (3) worth knowing about table design and anatomy. Continue reading
Fast-track publishing using knitr: exporting images for sharing and press (part III)
Fast-track publishing using knitr is a short series on how I use knitr to speedup publishing in my research. This is the third article in the series devoted to plots. Hopefully you will through this post have the need-to-know stuff so that you can (1) add auto-numbering to your figures, (2) decide on image formats, (3) choose image resolution, and (4) get anti-aliasing working. Continue reading
Fast-track publishing using knitr: the setup using .RProfile with custom CSS + some HTML goodies (part II)
Fast-track publishing using knitr is a short is a short series on how I use knitr to get my articles faster published. This is part II where I will show how you can tweak RStudio into producing seamless MS Word-integration by using the .RProfile together with CSS, a few basics about HTML that might be good to know, and lastly some special characters that can be useful. In the previous post, part I, I explained some of the more general concepts behind fast-track publishing and why I try to get my manuscript into MS Word instead of using LaTeX or other alternatives. Continue reading
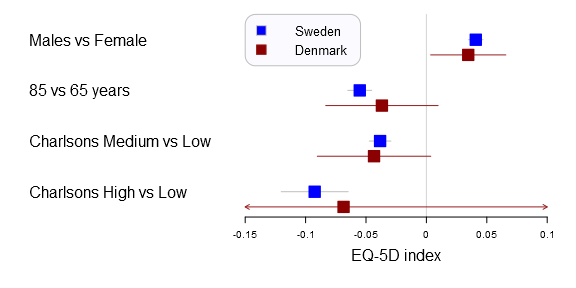
The forestplot of dreams
Displaying large regression models without overwhelming the reader can be challenging. I believe that forestplots are amazingly well suited for this. The plot gives a quick understanding of the estimates position in comparison to other estimates, while also showcasing the uncertainty. This project started with some minor tweaks to prof. Thomas Lumleys forestplot and ended up in a complete remake of the function. In this post I’ll show you how to tame the plot using data from my latest article. Continue reading
Too crude to be true?
The key to programming is being lazy; it has actually been called a virtue by some. When I discovered the update() function it blew me away. Within short I had created a monster based upon this tiny function, allowing quick and easy output of regression tables that contain crude and adjusted estimates. In this post I’ll show you how to tame the printCrudeAndAdjusted() function in my Greg-package and show a little behind the scenes. Continue reading
Visualizing transitions with the transitionPlot function
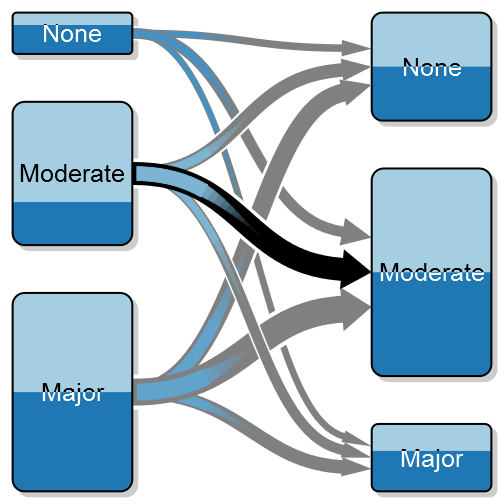
As an orthopaedic surgeon I’m often interested in how a patient is doing after surgery compared to before. I call this as a transition between states, e.g. severe pain to moderate pain, and in order to better illustrate these transitions I’ve created something that I call a transition plot. It’s closely related to the plotMat for plotting networks but aimed at less complex relations with only a one-way relation between two groups of states.
This project started by me posting a question on Stack Overflow, the answers were (as always) excellent, but didn’t really satisfy my needs. What I wanted was a graphically appealing plot that I could control in extreme detail. Thanks to Paul Murrell’s excellent grid package I was able to generate a truly customizeable transition plot.
In this post I’ll give a short introduction with examples to what you can do with the transitionPlot()-function. I’ll try to walk you through simple transitions to more complex ones with group proportions and highlighted arrows. Continue reading
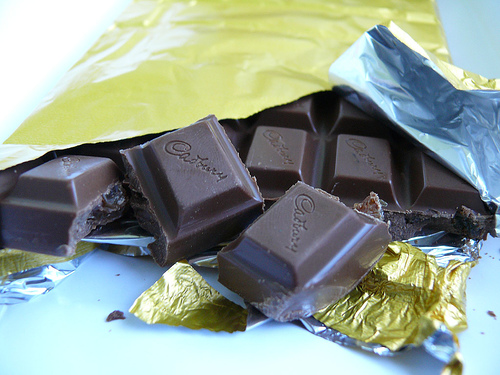
Chocolate and the Nobel Prize – a true story?
- F. H. Messerli, “Chocolate Consumption, Cognitive Function, and Nobel Laureates,” New England Journal of Medicine, vol. 367, no. 16, pp. 1562–1564, 2012.
- K. Ried, T. Sullivan, P. Fakler, O. R. Frank, and N. P. Stocks, “Does chocolate reduce blood pressure? A meta-analysis,” BMC Medicine, vol. 8, no. 1, p. 39, 2010.
Tutorial: Scraping the chocolate data with R
Getting started with Sweave & knitr
I recently started to work with Sweave (by Friedrich Leisch) and found it a truly awesome package. The ease of use is amazing. In this post I’ll try to get you started with first Sweave and then the knitr (by Yihui Xie). The knitr package is a more advanced version of Sweave, update: Start with knitr as it’s really well integrated into RStudio and is more actively developed.
Reasons for learning LaTeX & Sweave/knitr:
- You can export formatted tables (ready for publication)
- You connect the results with the actual calculations, minimizing risk of “copy->paste” errors
- The code is “automatically documented” as you explain the results in the text
- You can easily re-run the report on a new dataset
Now lets get started… Continue reading
Creating nice flow diagrams
My favorite tool for creating flow diagram is Dia – it’s easy and open source. It’s homepage is not that impressive but the Facebook group seems to be pretty active. There you can also find that downloads increased by 23 % in 2011 to 1.4 million downloads.
In this tutorial I want to show you how easy you can create a great looking flow diagram like the one CONSORT recommends for publication of RCT:s. Continue reading