Visualizing transitions with the transitionPlot function

A transition between states - the above is a imaginary plot of before and after surgery, where I've highlighted the large proportion that doesn't improve in the moderate group.

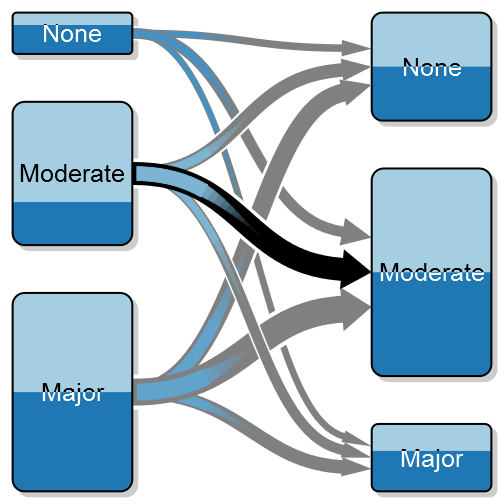
A transition between states – the above is a simulation of before and after surgery where I’ve highlighted the large proportion that doesn’t improve in the moderate group.

As an orthopaedic surgeon I’m often interested in how a patient is doing after surgery compared to before. I call this as a transition between states, e.g. severe pain to moderate pain, and in order to better illustrate these transitions I’ve created something that I call a transition plot. It’s closely related to the plotMat for plotting networks but aimed at less complex relations with only a one-way relation between two groups of states.

This project started by me posting a question on Stack Overflow, the answers were (as always) excellent, but didn’t really satisfy my needs. What I wanted was a graphically appealing plot that I could control in extreme detail. Thanks to Paul Murrell’s excellent grid package I was able to generate a truly customizeable transition plot.

In this post I’ll give a short introduction with examples to what you can do with the transitionPlot()-function. I’ll try to walk you through simple transitions to more complex ones with group proportions and highlighted arrows. Continue reading

Getting to the point – an alternative to the bezier arrow

An alternative bezier arrow to the regular grid-bezier. Apart from a cool gradient it has the advantages of: exact width, exact start/end points and axis alignment.

An alternative bezier arrow to the regular grid-bezier. Apart from a cool gradient it has the advantages of: exact width, exact start/end points and axis alignment.

About two weeks ago I got frustrated with the bezierGrob function in the grid package. The lwd parameter is interpreted differently depending on device, the arrow at the end does not follow the line but is perpendicular (probably following the spline control), and the line parameter makes it difficult to control exactly where the line starts/ends. Thus I decided to make my own fancy line with an arrow at the end – at the time I thought: How hard can it be? In retrospect, I wish I never thought of the thing… This article is about the painful process of creating of an alternative to the bezierGrob. Continue reading

Extracting comorbidities from a database in SPSS

Using large databases for extracting data can be cumbersome, fortunately it's more reliable than sifting for gold. The image is CC by Won-Tolla.

Using large databases for extracting data can be cumbersome, fortunately it’s more reliable than sifting for gold. The image is CC by Won-Tolla.

I put a lot of effort in to my first article to calculate the comorbidities of a patient according to the Charlson & Elixhauser scores. The available scripts were in SAS and Stata, as I started out using SPSS I decided to implement the code in the neat Python plugin that SPSS provides. In this post I’ll provide you with a detailed walk through of my code, and hopefully it will save you some time. Continue reading

Age before beauty

Sticking to the old, proven concepts have often turned out to be a good strategy in orthopaedics. Switching hip implants can be both cumbersome and hazardous. The image is CC by Trey Ratcliff.

Sticking to the old, proven concepts have often turned out to be a good strategy in orthopaedics. Switching hip implants can be both cumbersome and hazardous. The image is CC by Trey Ratcliff.

In my research I focus on patient factors and their impact on re-operation rates after total hip arthroplasties. While they do matter, the implant itself seems to be even more important. One of the most successful implant in the Swedish Hip Arthroplasty Registry is the Link Lubinus SP II implant, while some may argue that it’s an awesome design, I would argue that the tools that it comes with are awesome, thus limiting surgeon’s mistakes. This importance of skill is nicely illustrated in Peltola et al’s recent study, where they found an increased risk for revision during the first 3 years when introducing new implants, hazard ratio was 1.3 (95% CI 1.1 to 1.5) for the first 15 arthroplasties. This increased risk early on is commonly referred to as the learning curve, and may vary between implants. Continue reading

Using the SVD to find the needle in the haystack

Sitting on a data set with too many variables? The SVD can be a valuable tool when you're trying to sift through a large group of continuos variables. The image is CC by Jonas in China.

Sitting with a data set with too many variables? The SVD can be a valuable tool when you’re trying to sift through a large group of continuos variables. The image is CC by Jonas in China.

It can feel like a daunting task when you have a > 20 variables to find the few variables that you actually “need”. In this article I describe how the singular value decomposition (SVD) can be applied to this problem. While the traditional approach to using SVD:s isn’t that applicable in my research, I recently attended Jeff Leek’s Coursera class on Data analysis that introduced me to a new way of using the SVD. In this post I expand somewhat on his ideas, provide a simulation, and hopefully I’ll provide you a new additional tool for exploring data. Continue reading

Stroke and THR

Can the promise of the new life after a total hip arthroplasty becom shattered by a stroke? The image is CC by Andreas Levers.

Can the promise of the new life after a total hip arthroplasty becom shattered by a stroke? The image is CC by Andreas Levers.

A recent study from Denmark by Lalmohamed et al. looked at stroke risk after total hip replacements. It is interesting as this is a severe disease that can have a major impact on the life after a total hip arthroplasty. Even if it’s a rare event, the rates are similar to other serious negative outcomes such as early infections (less than 1%), and therefore just as valid endpoint to study. Continue reading

Exporting plain, lattice, or ggplot graphics

A blend between a basic scatterplot, lattice scatterplot and a ggplot

A blend between a basic scatterplot, lattice scatterplot and a ggplot

In a recent post I compared the Cairo packages with the base package for exporting graphs. Matt Neilson was kind enough to share in a comment that the Cairo library is now by default included in R, although you need to specify the type=”cairo” option to invoke it. In this post I examine how the ggplot and the lattice packages behave when exporting. Continue reading

Dr. when can I drive again?

When is it appropriate to return to driving? The image is CC by K嘛.

When is it appropriate to return to driving? The image is CC by K嘛.

As an orthopaedic surgeon I’m often confronted by patients asking me when they can return to driving. While this is a natural question, the answer is surprisingly difficult for us doctors. It is therefore nice to read MacLeod et al.’s and Fleury et al.’s excellent reviews on this subject, and yes: I’ve thankfully been in line with the evidence. Continue reading

Exporting nice plots from R

It's not always easy getting the right size. The image is CC by Kristina Gill.

It’s not always easy getting the right size. The image is CC by Kristina Gill.

A vital part of statistics is producing nice plots, an area where R is outstanding. The graphical ablility of R is often listed as a major reason for choosing the language. It is therefore funny that exporting these plots is such an issue in Windows. This post is all about how to export anti-aliased, high resolution plots from R in Windows. Continue reading

Spinal vs general anesthesia

Drops from a needle. The image is CC by Evan Leeson

Drops from a needle. The image is CC by Evan Leeson

Many of us orthopaedic surgeons have been frustrated by waiting for the anesthesiologist to finish with the spinal anesthesia. It is therefore of great relief that Pugely et al. write that this frustration is not in vain. Patients that receive spinal anesthesia seem to have fewer complications after a total knee arthroplasty than those with general anesthesia. A conclusion based on a large registry study with 14 000 patients although the overall odds ratio was though not that alarming, 1.3. Continue reading